Measure
PulseBoard
Every channel on one page: what happened in the period, which posts carry the load, when your audience watches and how far each account still is from getting paid. Measured with your own access, stored on your own machine.
Launch price until December 31, 2026, then $199
One payment, no subscription. The store opens shortly — send us a line and you get the download link as soon as it does. All sales are final once the download is delivered.
Any two tools for $249, all three for $349 — see the bundles.

Tiles with details
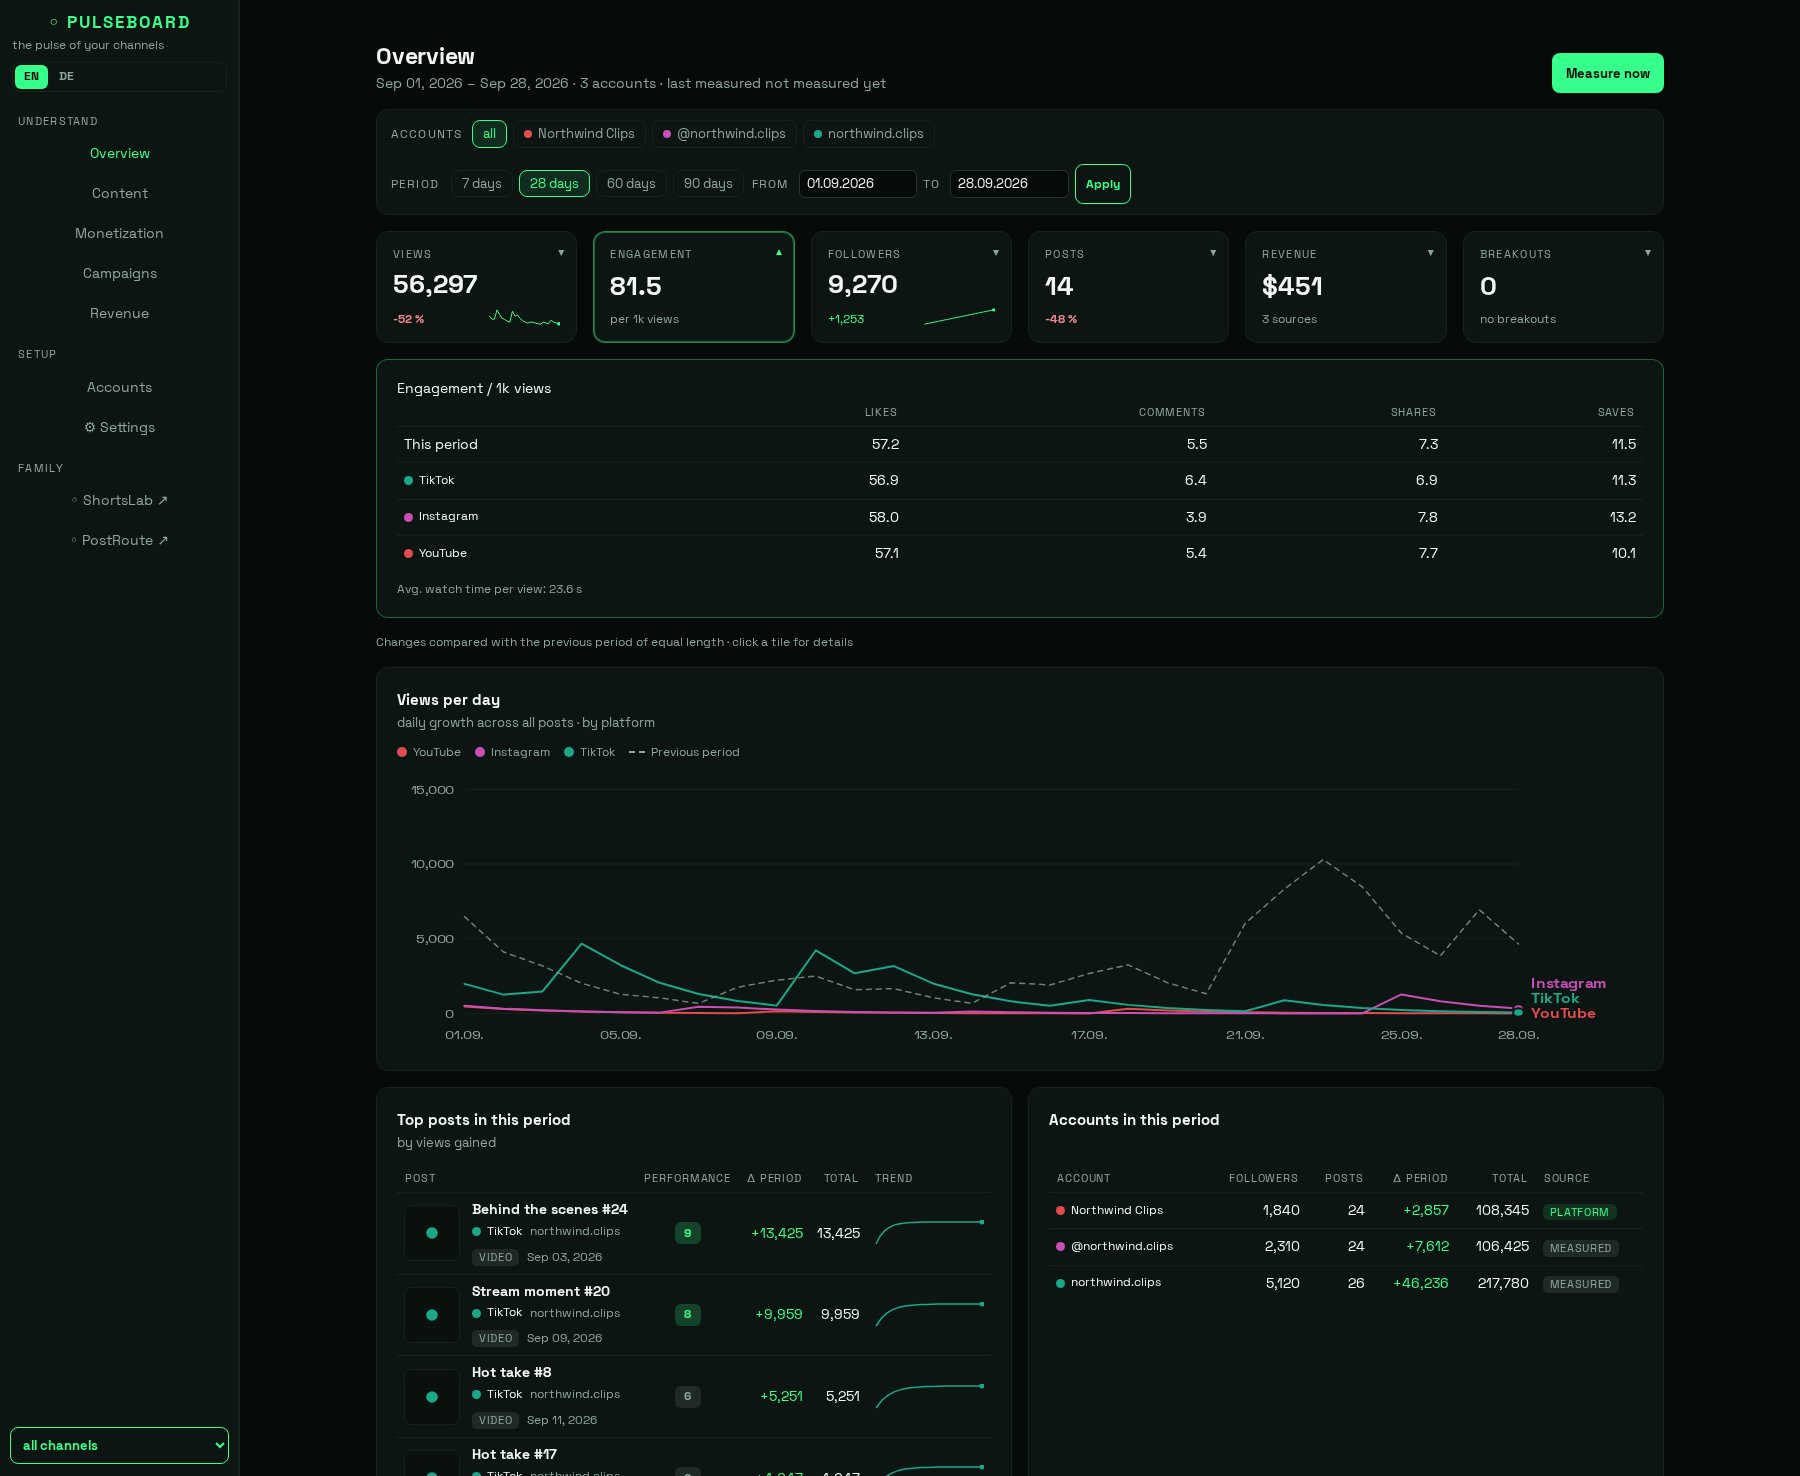
Every page opens with a row of tiles: views, engagement, followers, posts, revenue and breakouts — each with its trend and the change against the previous period of equal length.
Click a tile and its detail card opens right below, for example engagement per 1,000 views split by platform.
The chart carries the previous period as a dashed line, so you can tell a real rise from one good day.
Platforms
PulseBoard measures through the official APIs and your own access — split honestly by what each platform hands out:
Daily account figures
YouTube, Instagram and Facebook report daily values for the whole account, YouTube also engagement and watch time. The curve is the platform's own measurement.
Totals per post
TikTok, Threads, LinkedIn, X and Pinterest report lifetime totals per post. PulseBoard measures every day and builds the history from that.
Best posting times
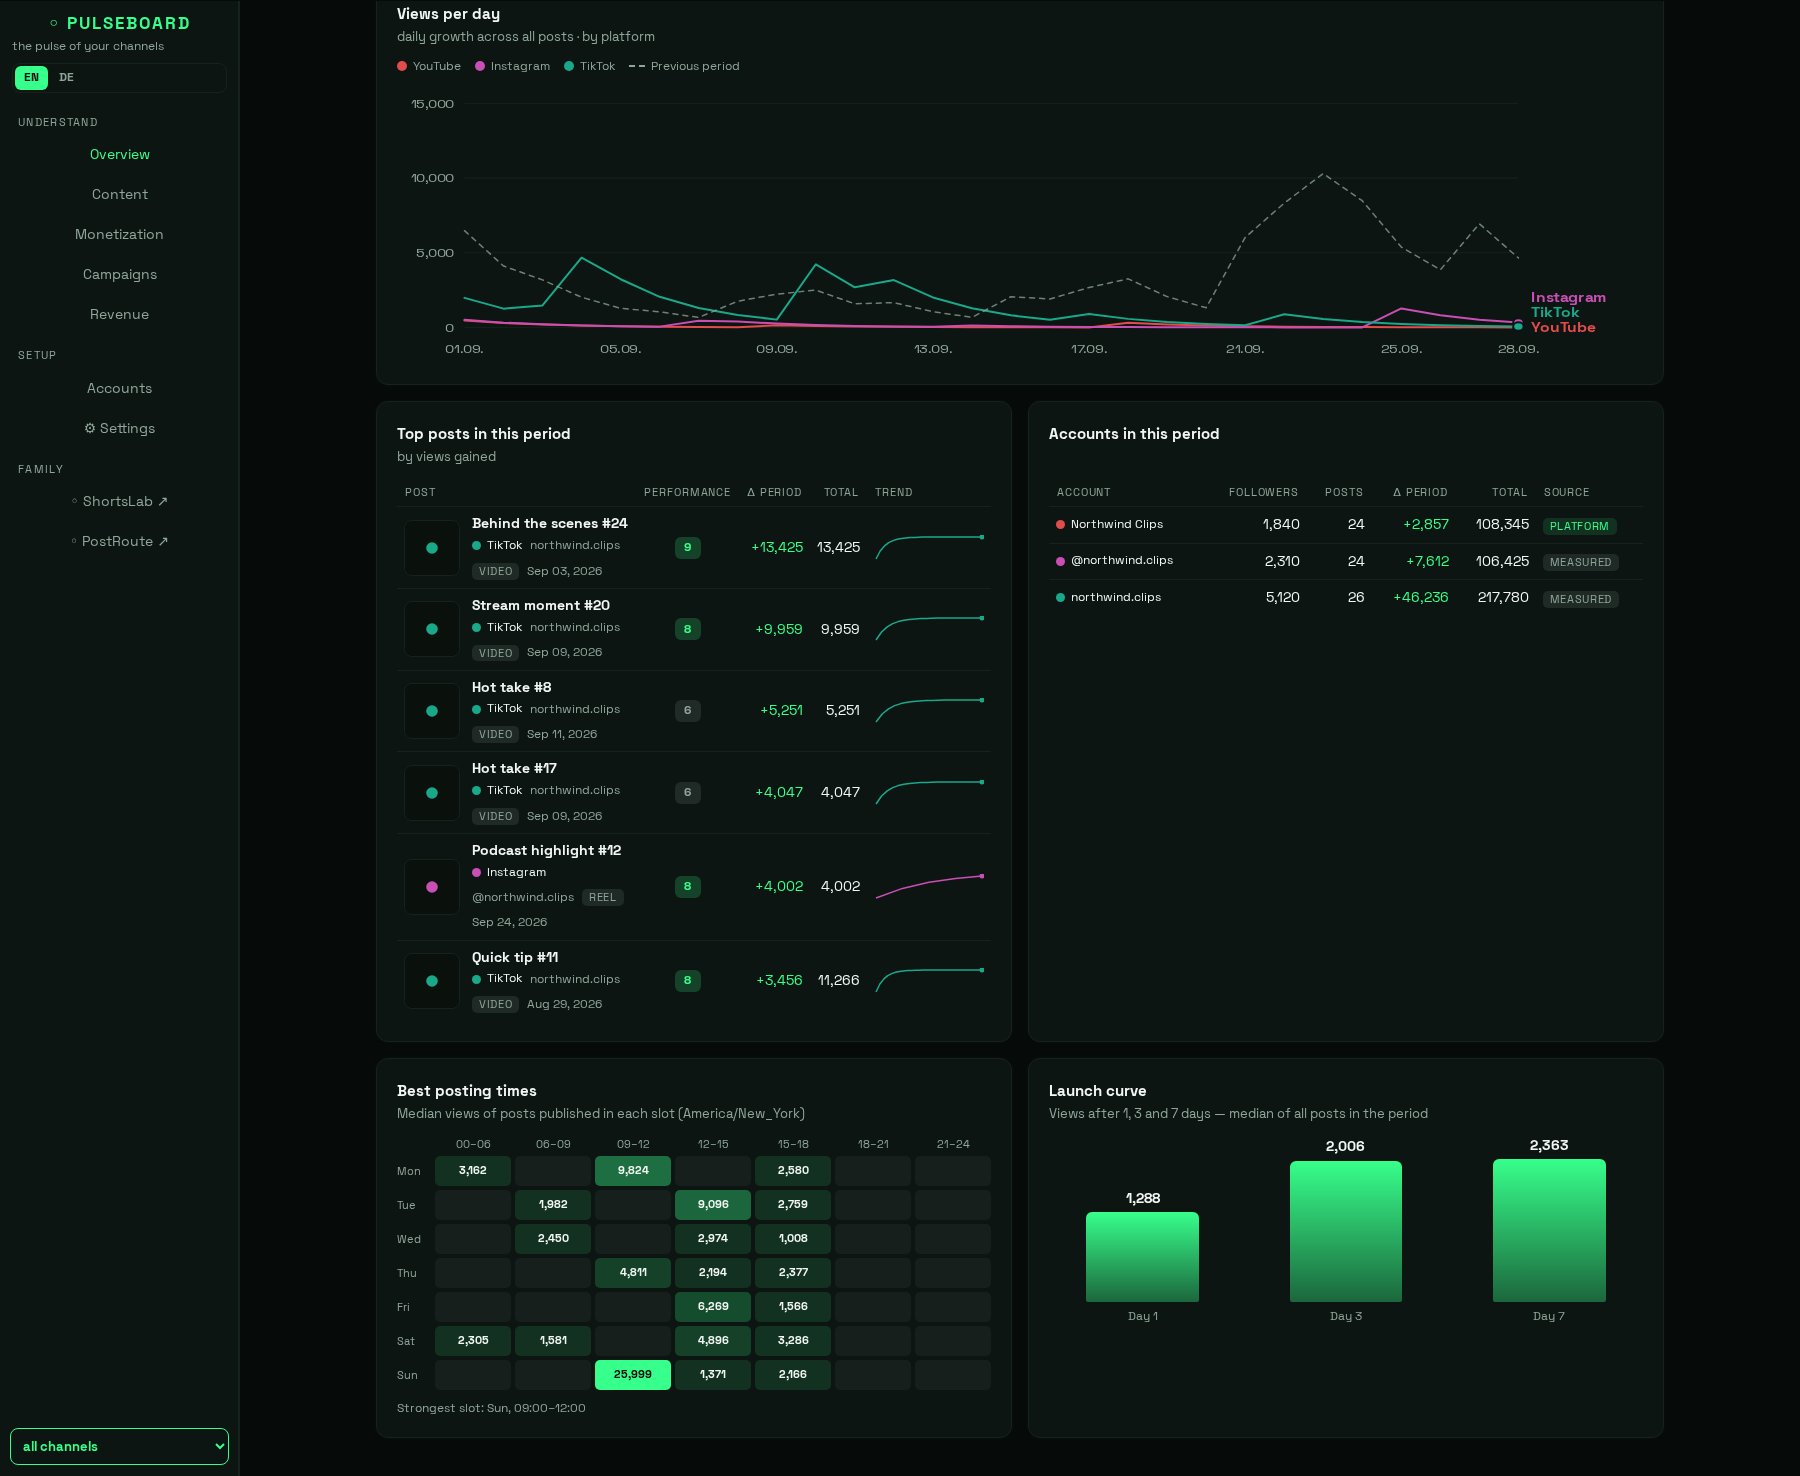
The heatmap places every post on weekday and time of day — in your audience's time zone, not yours. The strongest slot is spelled out below.
The launch curve shows the views a post typically has after one, three and seven days, so you can tell early whether a new post runs ahead of plan or behind it.
Both get sharper with every post measured.
Measurements and access tokens stay in your installation folder. No account with us.
PulseBoard collects once a day on its own. On Mondays it can send a weekly report to Telegram.
No subscription, no pricing by number of accounts. Updates are included.
Your strongest posts
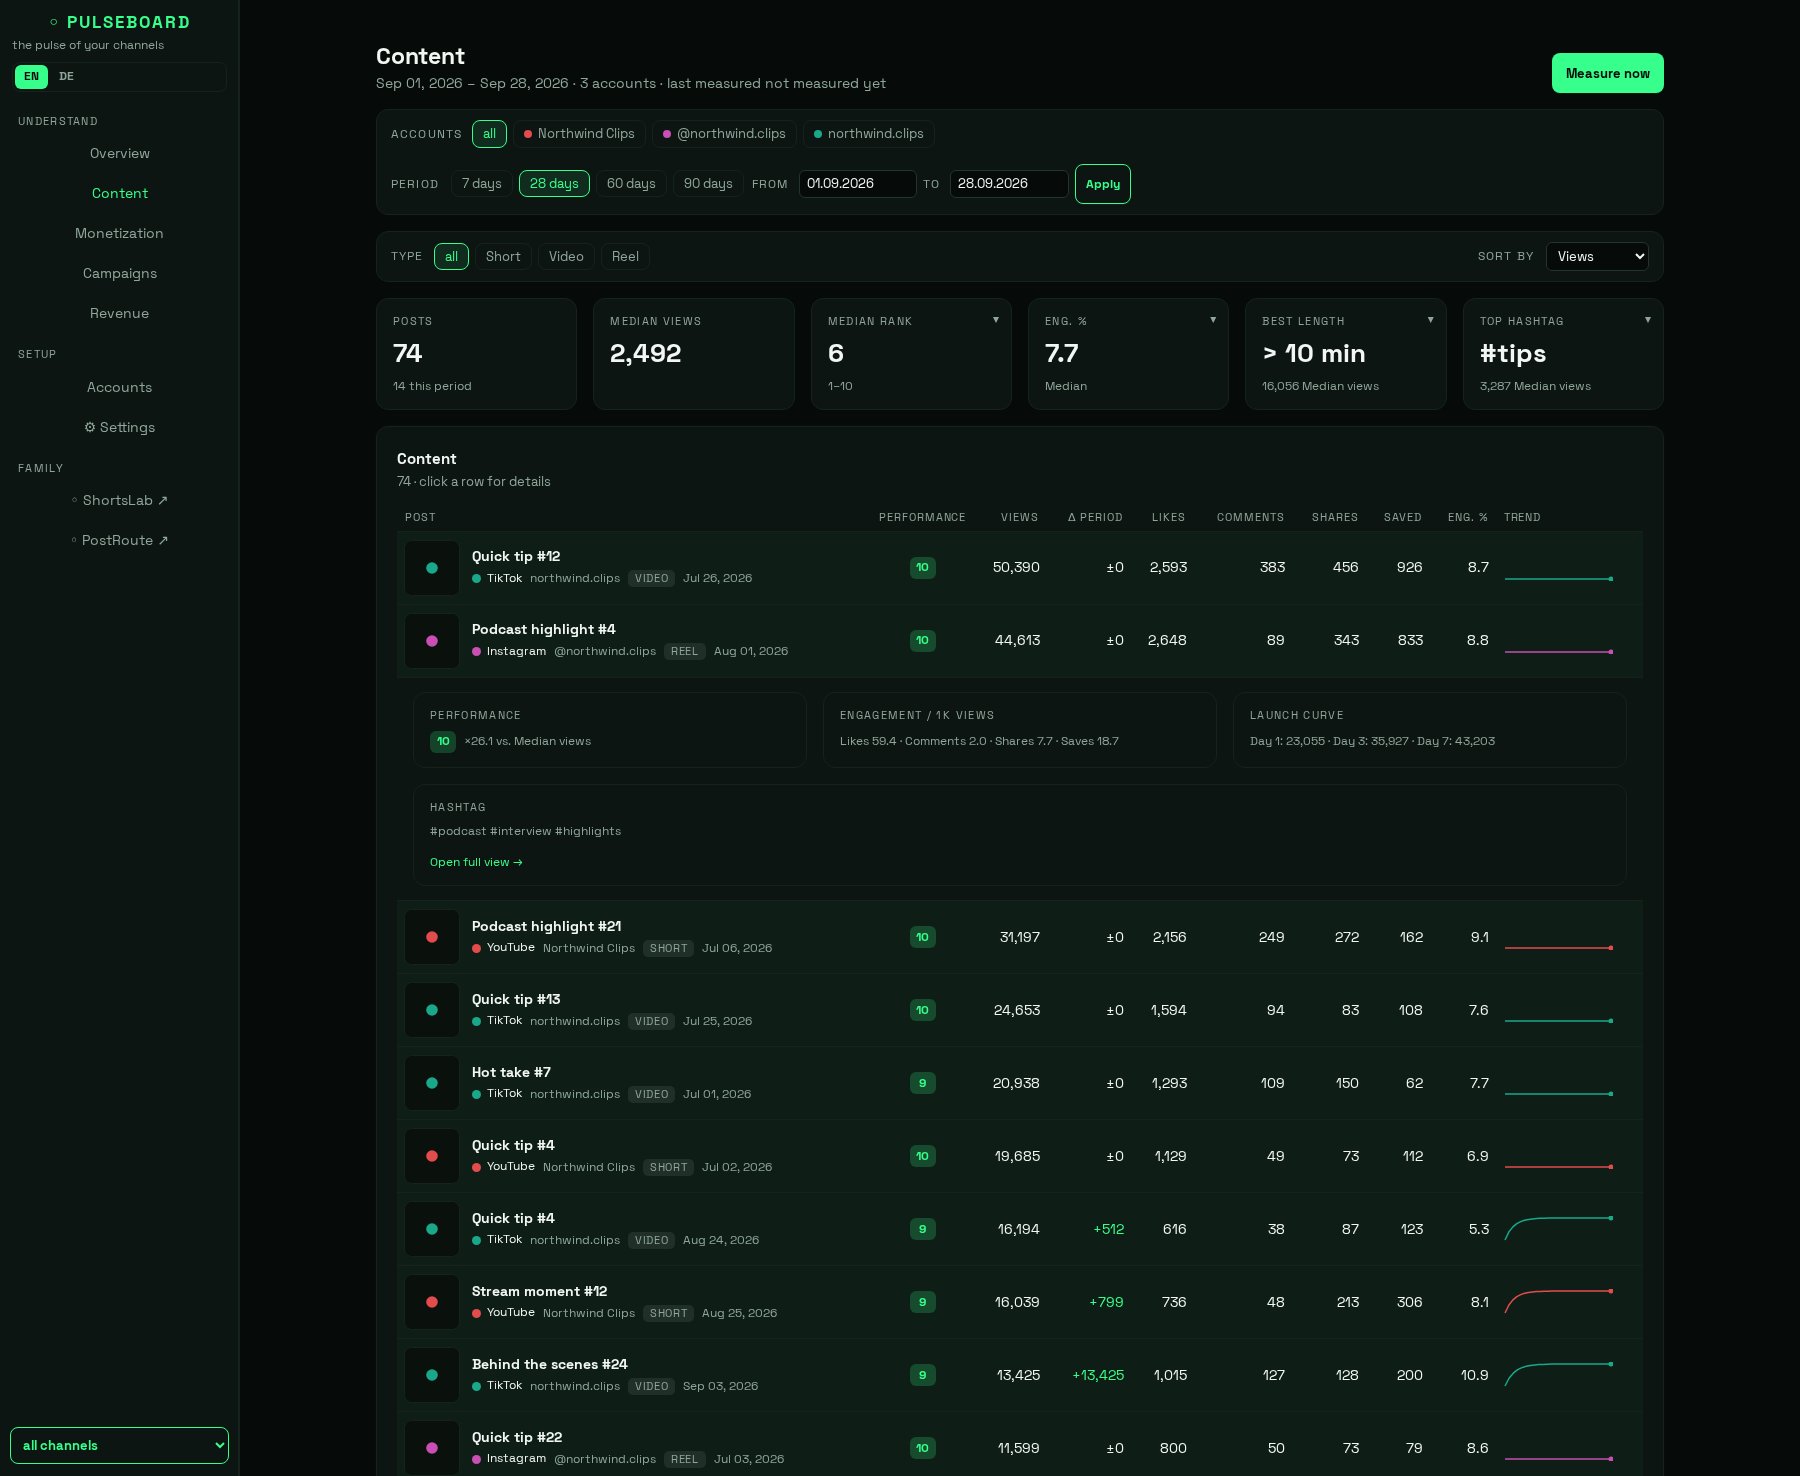
Every post gets a performance rank from 1 to 10, measured against the median of its own account — a small channel is never judged against a big one.
Click a row for the rank, engagement per 1,000 views, views after 1/3/7 days and the hashtags used.
The tiles above sum up which length and which hashtag brought the most views in the period.
Distance to payout
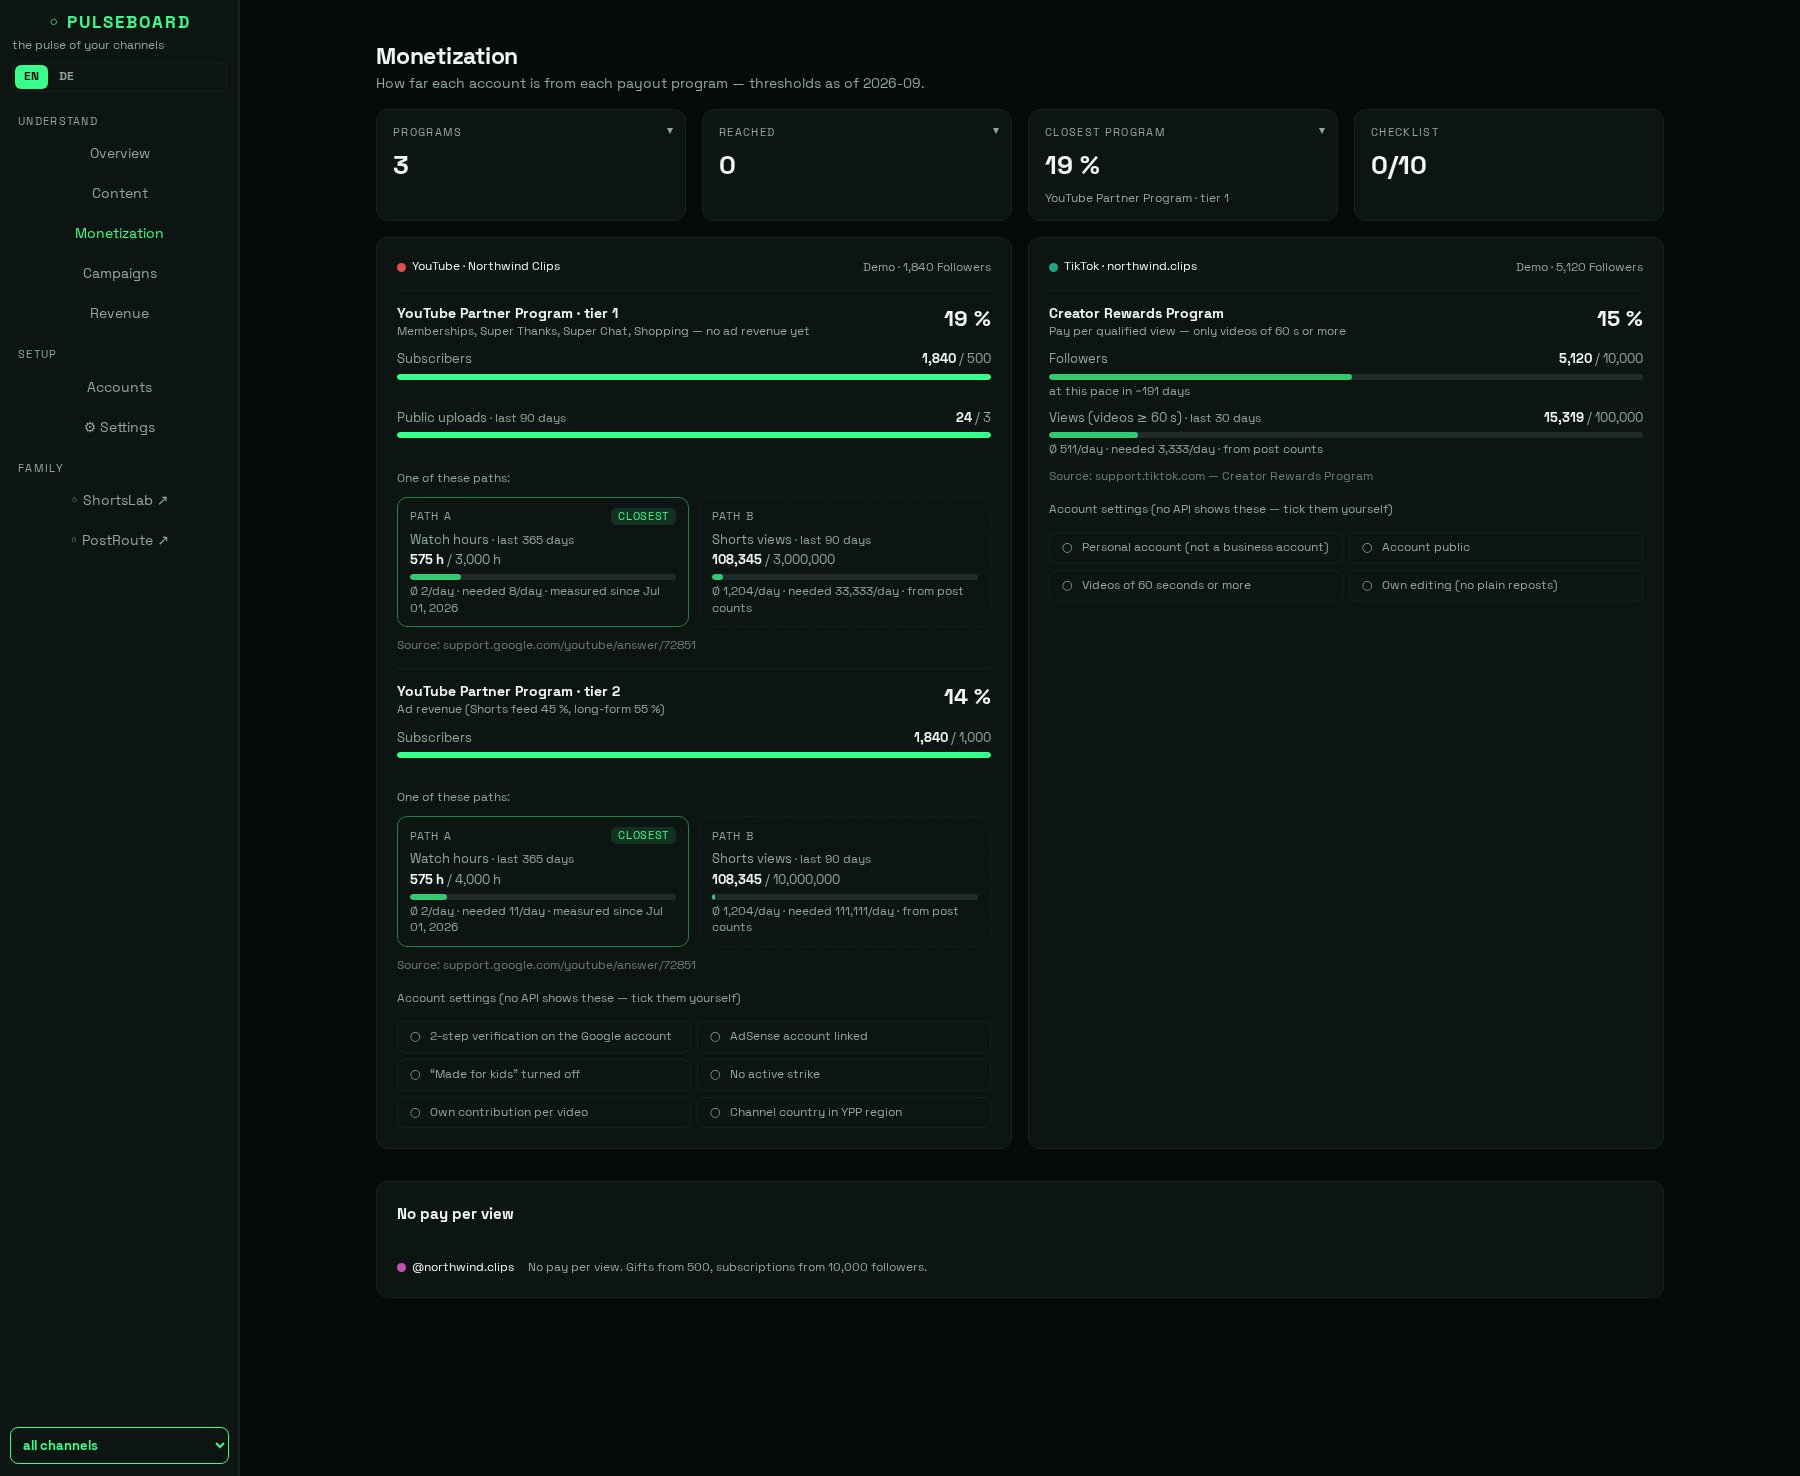
For every account PulseBoard shows how far it is from its platform's payout programs — the YouTube Partner Program or TikTok Creator Rewards, for example.
Where there are several routes it points out the closest one and works out how much is still needed per day.
What no API reveals, such as account settings, you tick off yourself. Every threshold comes with its source and date.
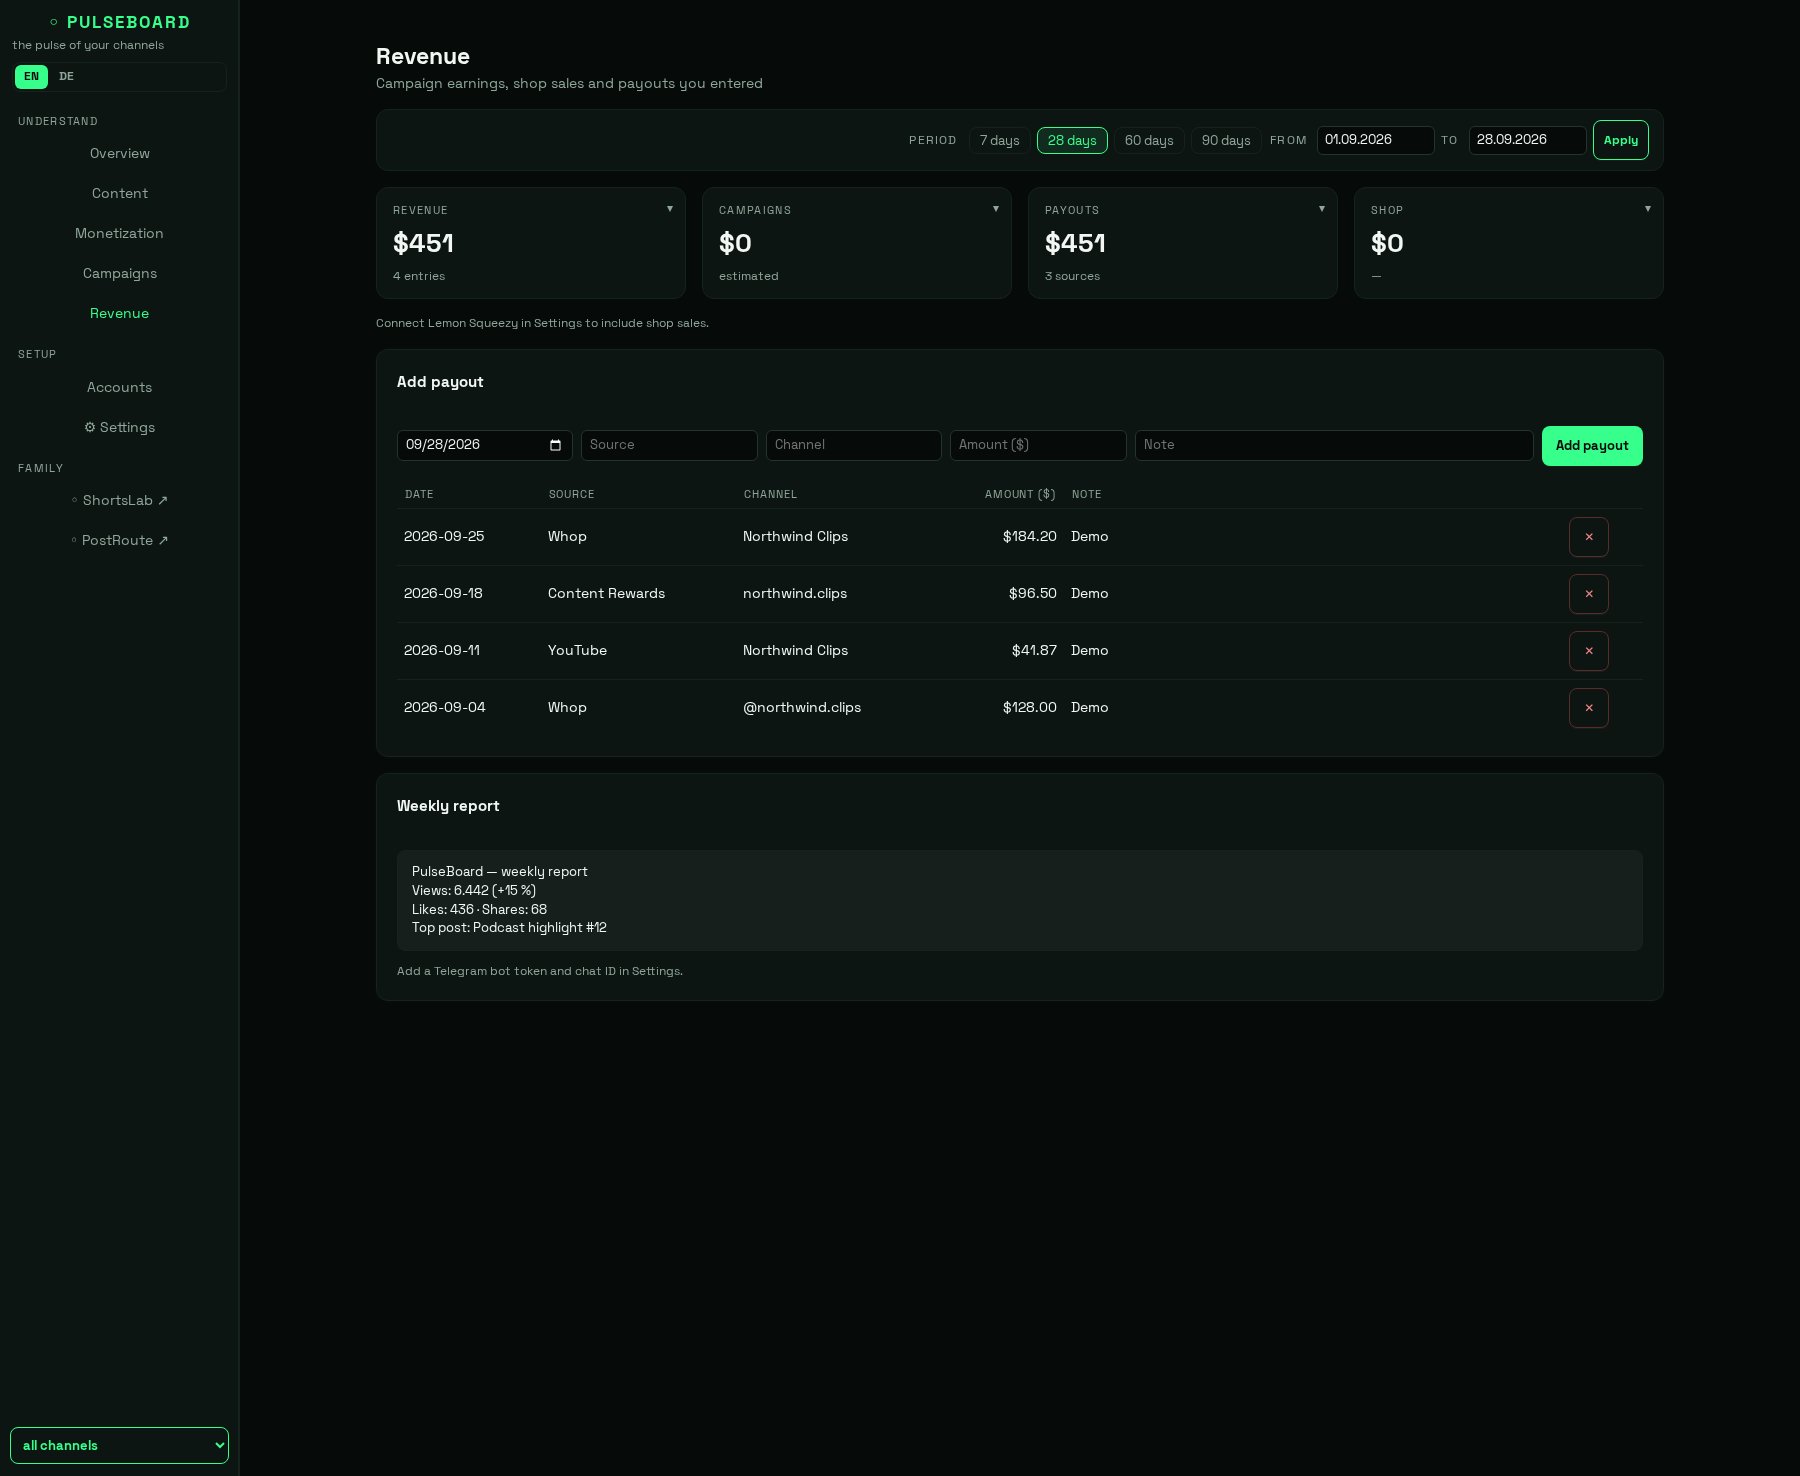
Revenue in one place
Campaign earnings, shop sales through Lemon Squeezy and payouts you enter yourself come together on one page.
The tiles split by source; the list below shows every entry with channel and note.
The weekly report sums up views, top post and breakouts — as text to copy, or sent to Telegram automatically.
Questions we get asked
| Do I need ShortsLab or PostRoute? | No. PulseBoard measures any account you connect, no matter how the posts were made. |
|---|---|
| Where do my numbers live? | In a database inside your installation folder. There is no service of ours in between. |
| How often does it measure? | Once a day on its own, plus whenever you press the button. The longer it runs, the more telling the comparisons get. |
| Can I look around first? | Yes. Demo mode fills PulseBoard with sample accounts — your own data stays untouched. |
| Requirements | Windows 10/11, macOS 12+ or Linux · Docker · 2 GB RAM. |
| Returns | The download is delivered immediately, so all sales are final. Details in the terms. |